Sunday, May 29, 2016

Internet of Things, my first "thing"

After watching this very nice episode of Tegenlicht about smart cities I got inspired to start sharing my experiences with my Raspberry Pi. I started playing with the Pi about 2 years ago and tried a most of the common sensors (temp, light, sound, movement, etc). The coming period I will start sharing my experiences. The is the Tegenlicht episode on smart cities, higly recommended!


By the end of this post we are able to view the temperature on a webpage which can be viewed with your computer or any mobile device of course.

The required hardware components:

- Raspberry Pi 2 or 3.. (35 euro)

- Wifi adapter
- SD card
- DHT11 Temparature sensor (2,45 euro)
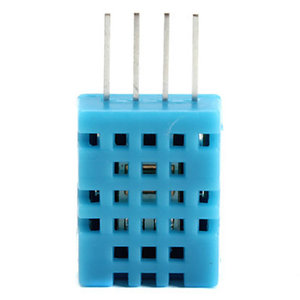
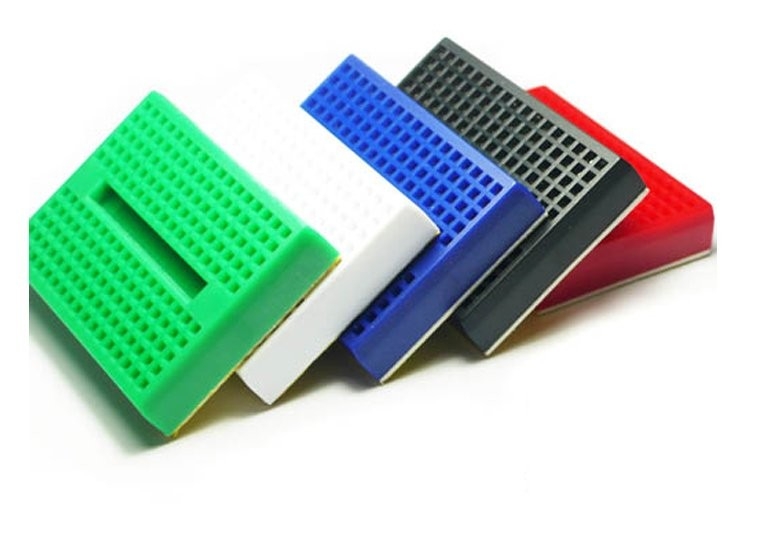
- mini breadboard (1,55 euro)
- 10 Kohm resistor (0,10 euro


Regarding the hardware purchase; I like to buy the Pi at SOS solutions because this guy makes sure the peripherals are high quality. You can get the Pi for a slightly lower price elsewere but he makes up with good service 7 days a week!

I buy all the componts at vanallesenmeer.nl. This shop offers the products at the lowest price possible and delivery has always been on time.  

Software used:
- Putty for telnet session
- FileZilla to transfer the files with FTP
- Notepad++ to edit / write the code. 

Putting it together:

This shows how I wired the DHT11:


It looks like this in real life:


The software:
We install the ADA fruit DHT library for convenience as instructed.
  
sudo apt-get update
sudo apt-get install build-essential python-dev
sudo python setup.py install

Now we can create a file with the following contents, just like the example that has been provided:

#!/usr/bin/python

import Adafruit_DHT
sensor = Adafruit_DHT.DHT11
pin = 18
humidity, temperature = Adafruit_DHT.read_retry(sensor, pin)

if humidity is not None and temperature is not None:
print 'Temp={0:0.1f}*C Humidity={1:0.1f}%'.format(temperature, humidity)
else:
print 'Failed to get reading. Try again!'

When you place this file in the /var/www/ folder next to a php file with the following contents you will be able to disply the temperature on a webpage.

<html>
<?php
echo exec('sudo python ./simpletest.py')
?>
</html>

You need to make the www-data group owner of the file:

sudo chown www-data temp.php

When you open the page in a browser the result looks like this. Mind its hot in the closet where the Pi resides..

Friday, May 27, 2016

Correlation in DAX

In this blogpost I show how to calculate the correlation in DAX. This post will be refined in the future, also to show the comparison with R. The code is shown so you see how to run it in DAX studio. We will investigate the correlation between visits and sales. We define the standard deviation for visits:
    
DEFINE
MEASURE Visits[sdtotal_visits] =
CALCULATE (
STDEVX.P ( VALUES ( 'Visit Date'[Month] ), [Completed Visits] ),
ALLSELECTED ( 'Visit Date' )
)

We define the mean for visits:
    
MEASURE Visits[meantotal_visits] =
CALCULATE (
AVERAGEX ( VALUES ( 'Visit Date'[Month] ), [Completed Visits] ),
ALLSELECTED ( 'Visit Date' )
)
Same for value
    
MEASURE Visits[sdtotal_ov] =
CALCULATE (
STDEVX.P ( VALUES ( 'Visit Date'[Month] ), [Order Value] ),
ALLSELECTED ( 'Visit Date' )
)
MEASURE Visits[meantotal_ov] =
CALCULATE (
AVERAGEX ( VALUES ( 'Visit Date'[Month] ), [Order Value] ),
ALLSELECTED ( 'Visit Date' )
)
We multiply the two standard deviations:
    
MEASURE Visits[sdsd] =
CALCULATE ( [sdtotal_visits] * [sdtotal_ov] )
We calculate the deviation from the mean for each measure:
    
MEASURE Visits[afwijking_visits] =
CALCULATE ( ( [Completed Visits] - [meantotal_visits] ) )
MEASURE Visits[afwijking_value] =
CALCULATE ( ( [Order Value] - [meantotal_ov] ) )
We calculate the average of the product of the two deviations:
    
MEASURE Visits[avgproduct] =
CALCULATE (
AVERAGEX (
VALUES ( 'Visit Date'[Month] ),
[afwijking_visits] * [afwijking_value]
),
ALLSELECTED ( 'Visit Date' )
)
We devide this value of the product of the two SD's
    
MEASURE Visits[correlation2] =
CALCULATE ( [avgproduct] / [sdsd] )
Now the query to view the results:
    
EVALUATE
CALCULATETABLE (
ADDCOLUMNS (
SUMMARIZE ( 'Visit Date', 'Visit Date'[Month] ),
"Visits", [Completed Visits],
"order value", [Order Value],
"correlation2", [correlation2]
),
'Visit Date'[Month Key] = "2015M12"
|| 'Visit Date'[Month Key] = "2016M01"
|| 'Visit Date'[Month Key] = "2016M02"
)

Tuesday, May 24, 2016

Image to data frame to ggplot heatmap

Image to DF to ggplot

In this post we will convert an image to a dataframe to display the image with ggplot. In a later post we will compress the image.

library("png", lib.loc="C:/TFS/Rlib/")
require(ggplot2)
## Loading required package: ggplot2

This is the original image:

Original.

The work

plaatje = readPNG("c:/TFS/test.png")
x <- data.frame(1:100,1,1,1,1,1)
colnames(x) = c("t", "x","y", "r", "g", "b")
for (a in 1:3) {
teller = 1
for (i in 1:length(plaatje[,1,a])) { #Hoogte
for (j in 1:length(plaatje[i,,a])) { #Breedte
x[teller,c(1:3,3+a)] = c(teller,j,i,plaatje[i,j,a])
teller = teller + 1
}
}
}


ggplot(data=x, aes(x=x, y=y, fill=rgb(r,g,b))) +
geom_tile() +
scale_fill_identity()