Add Speed Metrics like ‘Average Moving Speed’ to Strava Activity descriptions Using Python
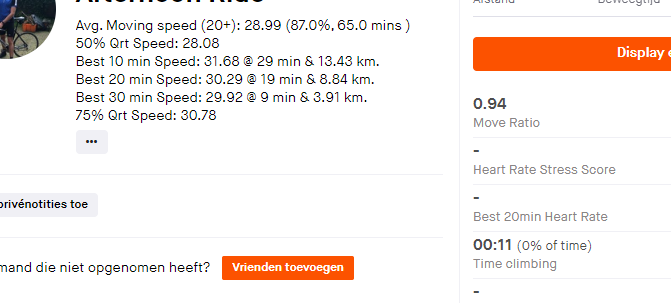
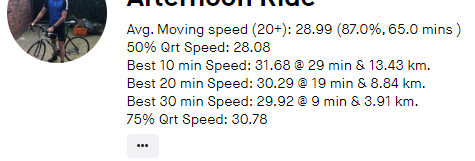
This article describes how to automatically update your Strava Activities description with multiple speed metrics using Python. The result looks like this:

The Jupyter notebook can be found here. The full Python code can be found here.
Use Case
I was looking to compare the performance of my rides (using my mobile) whereby I don’t need to rely on the average speed of the ride alone since this can be heavily negatively impacted by brief stops.
Average Moving Speed
Initially, I installed the Chrome Add-In called ‘Elevate’. This great Add-In allows you to view additional metrics about your ride.

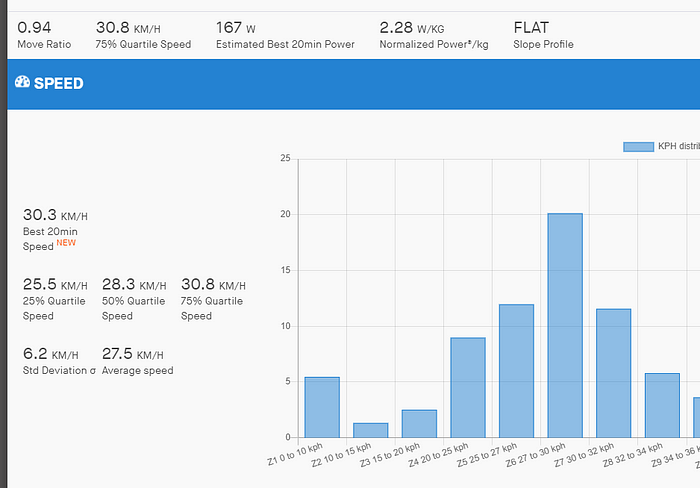
I thought it made sense to look at the 75% quartile speed as described by Elevate:
This option adds new speed/pace data to your activity panel.
For understanding these indicators, we assume that 0% to 100% are all the speeds/paces sorted ascending you obtained during an activity.
25% Quartile: This indicator represents the speed/pace you maintained at the position “25%”. This is commonly called “Lower quartile” or Q1.
50% Median: This indicator represents the speed/pace you maintained at the position “50%”. It’s simply the median…
75% Quartile: This indicator represents the speed/pace you maintained at the position “75%”. This is commonly called “Upper quartile” or Q3.
These indicators can be more meaning full than average speed/pace itself to analyse activity speed/pace. For example, you upload an activity in which you ride pretty fast for a long time. Then, you expect to have a good average speed. Unfortunately, you have to go through the city to go home where many red lights and cars behavior slow you down. Your average speed/pace then drops very quickly and do not highlight your effort of “riding fast”. In this example, the 75% quartile speed/pace is representative of the effort you made (eliminating slow speeds/paces associated with the cross of the city).
Since I was not entirely satisfied with this metric I created an alternative one, the “Average Moving Speed (20+)”.
This metric is calculated by eliminating all activity data points where you are biking less than 20 KM/H and then re-calculating the average speed. This metric describes the average speed when I am actually biking and not waiting for a traffic light f.e.
Average moving speed — Implementation
In order to calculate the “Average Moving Speed” the following steps are executed in Python:
- Retrieve the activity data points (time and distance).
- Calculate speed per data point:
- Per Data Point calculate the time and distance difference compared to the previous data point.
- Calculate the speed for each data point using the time & distance differences.
3. Sort the data frame on speed.
4. Select all the data points where the speeds are lower than 20 KM/H.
5. Calculate the max time and distance in 4.
6. Deduct 5 from the total activity time & distance (1).
7. Re-calculate the average speed using 6.
There is probably a more elegant way to do this, I am always open to suggestions.
The code for the above steps is given in lines 20–28 in the below code snapshot.
def update_activity_post(idpar, distpar, timepar): | |
r = get_activitydata(idpar) | |
if list(r.keys())[0] == 'distance': | |
df_res = create_dataframe(r) | |
if max(df_res['time']) / 60 > 10: | |
result_10 = calculate_split(df_res, 10) | |
else: | |
result_10 = ['0', '0', '0'] | |
if max(df_res['time']) / 60 > 20: | |
result_20 = calculate_split(df_res, 20) | |
else: | |
result_20 = ['0', '0', '0'] | |
if max(df_res['time']) / 60 > 30: | |
result_30 = calculate_split(df_res, 30) | |
else: | |
result_30 = ['0', '0', '0'] | |
subset = df_res[df_res['speed']<=20] | |
maxtimediff = max(subset['sumcumtimediff']) | |
maxdistdiff = max(subset['sumcumdistdiff']) | |
movingspeed = round((((distpar - maxdistdiff) / (timepar - maxtimediff)) * 3.6),2) | |
timemoving = round(((timepar - maxtimediff) / 60),0) | |
prctimemoving = round((((timepar - maxtimediff) / timepar) * 100),0) | |
data = { | |
'description': 'Avg. Moving speed (20+): ' + str(movingspeed) + ' (' + str(prctimemoving) + '%, ' + str(timemoving) + ' mins )' + ''' | |
50% Qrt Speed: ''' + str(round(min(df_res[df_res['percentilerounded']==50]['speed']),2)) + ''' | |
Best 10 min Speed: ''' + result_10[0] + ' @ ' + result_10[1] + ' min & ' + result_10[2] + ' km.' + ''' | |
Best 20 min Speed: ''' + result_20[0] + ' @ ' + result_20[1] + ' min & ' + result_20[2] + ' km.' + ''' | |
Best 30 min Speed: ''' + result_30[0] + ' @ ' + result_30[1] + ' min & ' + result_30[2] + ' km.' + ''' | |
75% Qrt Speed: ''' + str(round(min(df_res[df_res['percentilerounded']==75]['speed']),2)) | |
} | |
update_post(idpar, data) |
Full implementation — code walkthrough
In order to update the description of multiple recent Strava ride activities with several metrics, a number of steps are required.
- Get an Access token for the Strava API.
- Retrieve recent activities.
- Per activity:
- Store Data Points in Data Frame.
- Calculate Metrics like (10 minutes Best Speed, 75% quartile speed, Average Moving Speed)
- Update Strava Activity
The code
- Get an Access token for Strava API
For this part, I could rely on a great post by
. My implementation of his code is given below:One part was very important here, the scope, you need to ask for scope=read,activity:read_all,activity:write
Without this level of authorization, we will not be able to update the Strava Activity post.
The above Python code execution is a one-time effort, from here we can refresh the token.
The below function will refresh the token:
#refresh token | |
def refresh_token(): | |
import requests | |
import json | |
import time | |
# Get the tokens from file to connect to Strava | |
with open('strava_tokens.json') as json_file: | |
strava_tokens = json.load(json_file) | |
# If access_token has expired then | |
# use the refresh_token to get the new access_token | |
if strava_tokens['expires_at'] < time.time(): | |
# Make Strava auth API call with current refresh token | |
print('token refreshed') | |
response = requests.post( | |
url = 'https://www.strava.com/oauth/token', | |
data = { | |
'client_id': 01234, | |
'client_secret': '----', | |
'grant_type': 'refresh_token', | |
'refresh_token': strava_tokens['refresh_token'] | |
} | |
) | |
# Save response as json in new variable | |
new_strava_tokens = response.json() | |
# Save new tokens to file | |
with open('strava_tokens.json', 'w') as outfile: | |
json.dump(new_strava_tokens, outfile) | |
# Use new Strava tokens from now | |
strava_tokens = new_strava_tokens | |
# Open the new JSON file and print the file contents | |
# to check it's worked properly | |
with open('strava_tokens.json') as check: | |
data = json.load(check) | |
print(data) |
2. Retrieve Recent Activities
The below code is the main code that loops through recent activities to calculate several metrics and finally update the Strava Activity.
#GET ACTIVITIES | |
import requests | |
import pandas as pd | |
from pandas.io.json import json_normalize | |
import json | |
import csv | |
refresh_token() | |
# Get the tokens from file to connect to Strava | |
with open('strava_tokens.json') as json_file: | |
strava_tokens = json.load(json_file) | |
# Loop through all activities | |
url = "https://www.strava.com/api/v3/activities" | |
access_token = strava_tokens['access_token'] | |
# Get first page of activities from Strava with all fields | |
r = requests.get(url + '?access_token=' + access_token) | |
r = r.json() | |
df = pd.json_normalize(r) | |
#df.to_csv('strava_activities_all_fields.csv') | |
df.head(n=20) | |
for index, acrow in df.head(n=2).iterrows(): | |
print(acrow['id']) | |
if acrow['distance'] > 2000 and acrow['type'] == 'Ride': | |
update_activity_post(acrow['id'], acrow['distance'], acrow['elapsed_time'] ) |
- The token is refreshed in line 8.
- The activities are retrieved and stored in a data frame in lines 13–19.
- For each activity, metrics are calculated and published to Strava on lines 23 to 26.
3. Per activity
The main function (called in line 26 in ‘Get Activity Code’, see above) to calculate the metrics and update each Strava Activity is given below:
def update_activity_post(idpar, distpar, timepar): | |
r = get_activitydata(idpar) | |
if list(r.keys())[0] == 'distance': | |
df_res = create_dataframe(r) | |
if max(df_res['time']) / 60 > 10: | |
result_10 = calculate_split(df_res, 10) | |
else: | |
result_10 = ['0', '0', '0'] | |
if max(df_res['time']) / 60 > 20: | |
result_20 = calculate_split(df_res, 20) | |
else: | |
result_20 = ['0', '0', '0'] | |
if max(df_res['time']) / 60 > 30: | |
result_30 = calculate_split(df_res, 30) | |
else: | |
result_30 = ['0', '0', '0'] | |
subset = df_res[df_res['speed']<=20] | |
maxtimediff = max(subset['sumcumtimediff']) | |
maxdistdiff = max(subset['sumcumdistdiff']) | |
movingspeed = round((((distpar - maxdistdiff) / (timepar - maxtimediff)) * 3.6),2) | |
timemoving = round(((timepar - maxtimediff) / 60),0) | |
prctimemoving = round((((timepar - maxtimediff) / timepar) * 100),0) | |
data = { | |
'description': 'Avg. Moving speed (20+): ' + str(movingspeed) + ' (' + str(prctimemoving) + '%, ' + str(timemoving) + ' mins )' + ''' | |
50% Qrt Speed: ''' + str(round(min(df_res[df_res['percentilerounded']==50]['speed']),2)) + ''' | |
Best 10 min Speed: ''' + result_10[0] + ' @ ' + result_10[1] + ' min & ' + result_10[2] + ' km.' + ''' | |
Best 20 min Speed: ''' + result_20[0] + ' @ ' + result_20[1] + ' min & ' + result_20[2] + ' km.' + ''' | |
Best 30 min Speed: ''' + result_30[0] + ' @ ' + result_30[1] + ' min & ' + result_30[2] + ' km.' + ''' | |
75% Qrt Speed: ''' + str(round(min(df_res[df_res['percentilerounded']==75]['speed']),2)) | |
} | |
update_post(idpar, data) |
This function uses a number of supporting functions that are described below:
- get_activitydata (retrieves the activity data points).
- create_dataframe (creates a data frame with additional calculated values that support calculating the metrics)
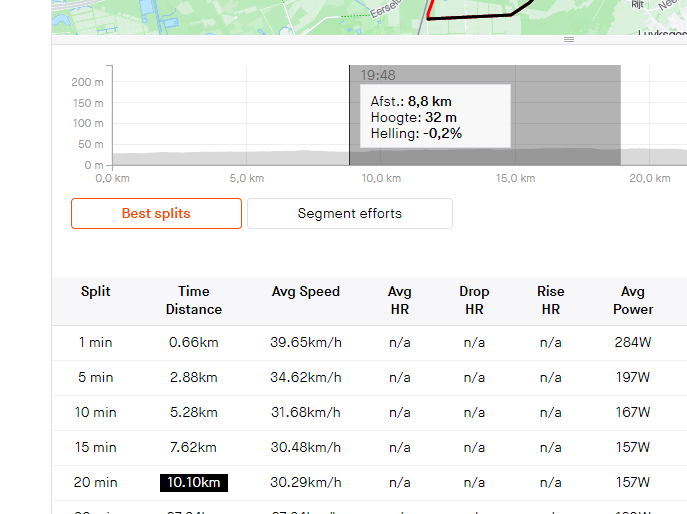
- calculate_split (returns the best speed held for the provided amount of time)
- update_post (updates the description of the Strava Activity Post)
Supporting functions
get_activitydata performs a basic API call to retrieve recent activities.
def get_activitydata(idpar): | |
url = "https://www.strava.com/api/v3/activities/" + str(idpar) + "/streams/time" | |
r = requests.get(url + '?access_token=' + access_token + '&types=["time"]&key_by_type=true') | |
r = r.json() | |
return r |
create_dataframe takes the JSON activity data and returns a pandas data frame with additional supporting columns to support the calculation of multiple speed metrics.
def create_dataframe(r): | |
df = pd.DataFrame(r['distance']['data']) | |
df2 = pd.DataFrame(r['time']['data']) | |
df3= pd.concat([df, df2], axis=1) | |
df_res = pd.concat([df3.shift(1), df3], axis=1) | |
df_res.columns = ['dist-1', 'time-1', 'dist', 'time'] | |
df_res['time_diff'] = df_res['time'] - df_res['time-1'] | |
df_res['dist_diff'] = df_res['dist'] - df_res['dist-1'] | |
df_res['speed'] = (df_res['dist_diff'] / df_res['time_diff']) * 3.6 | |
df_res['sumcumtimediff'] = df_res.sort_values(by=['speed'], ascending=True)['time_diff'].cumsum() | |
df_res['sumcumdistdiff'] = df_res.sort_values(by=['speed'], ascending=True)['dist_diff'].cumsum() | |
time = df_res.loc[df_res['speed'].size-1]['time'] | |
df_res['percentile'] = (df_res['sumcumtimediff']) / time | |
df_res['percentilerounded'] = round((df_res['percentile'] * 100) , 0) | |
return df_res |
Lines 2–3 retrieve the distance and elapsed time lists.
Line 4 creates a data frame.
Line 5 joins the data frame with itself and joins the rows by index, whereby its joining on the previous row so the time and distance difference between the current and previous row can be calculated.
Lines 7 & 8 calculate the differences.
Line 9 calculates the speed based on the differences.
Lines 10 & 11 calculate the cumulative for speed and time.
Line 12 retrieves the total time duration of the activity.
Line 13 can then calculate the speed percentile, this is the percentile position of the sorted speed. This supports the 25%, 50%, and 75% percentile speed positions as defined by Elevate.
calculate_split returns the best speed that was held for the provided time period. Lines 8 & 9 find the row that is closest to the start of the provided time frame. This was required because each row does not represent a fixed time difference from the next row.
Lines 23 and 24 retrieve the time and distance when the best split started.
def calculate_split(df_res, minutes): | |
lst = [] | |
#minutes = 20 | |
interval = minutes * 60 | |
for index, row in df_res.iterrows(): | |
if df_res[df_res['time']<=row['time']-interval]['time'].size != 0: | |
val = max(df_res[df_res['time']<=row['time']-interval]['time']) | |
record = df_res[df_res['time']==val] | |
timediff = row['time'] - record['time'] | |
distdiff = row['dist'] - record['dist'] | |
speed = (distdiff / timediff) * 3.6 | |
#print(str(row['time']) + " avg speed " + str(speed.to_string(index=False))) | |
lst.append(float(speed.to_string(index=False))) | |
else: | |
lst.append(0) | |
val = max(lst) | |
p = lst.index(val) | |
df2 = df_res.filter(items = [p], axis=0) | |
timeval = max(df_res[df_res['time']<=int(float((df2['time']-(60*minutes)).to_string(index=False)))]['time']) | |
kmrecord = df_res[df_res['time']==timeval] | |
#print(int(float((df2['time']-(60*minutes)).to_string(index=False)))) | |
return [str(round(val,2)), str(int(float(((df2['time']/60)-minutes).to_string(index=False)))), | |
str(round(float(((kmrecord['dist']/1000)).to_string(index=False)),2))] |
A quick comparison with Elevate shows identical results:


update_post updates the description of the Strava Activity with the metrics that have been calculated.
def update_post(idpar, datapar): | |
endpoint = "https://www.strava.com/api/v3/activities/" + str(idpar) | |
data = datapar | |
headers = {"Authorization": "Bearer " + access_token} | |
requests.put(endpoint, data=data, headers=headers).json() | |
print('updated') |
Conclusion
I hope this article is of value to you. I wrote it to learn from you how to improve and to help people get a head start with creating something similar.
The jupyter notebook can be found here. The full python code can be found here.
This article has been posted on medium as well, please find it here.
No comments:
Post a Comment